Document Focus
This document covers two essential concepts in Microsoft Dynamics 365 Finance and Operations analytics:
Business Performance Analytics (BPA)
• Installation and Standard Reporting
• How facts and dimensions drive value chain analysis
Dynamics 365 ERP Analytics Making Reporting Simple
• How the ERP Model Context Protocol (MCP) server works
• How it enables secure, structured, and scalable reporting In short:
BPA structures the data. MCP exposes it intelligently.
You deliver process-driven insights.
Understanding MCP for Analytics in Microsoft Dynamics 365 Finance and Operations
In any ERP system, reporting can quickly become complex because transactional data is stored across many interconnected tables. Writing reports directly on this raw data often requires deep technical knowledge and can lead to inconsistent results.
MCP for Analytics addresses this challenge by providing a structured and simplified analytical layer for reporting in D365 FO. Instead of accessing transactional tables (Purchase Orders, Sales Orders, Ledgers etc.) directly, users and reporting tools consume curated analytical models designed specifically for analysis.
This ensures:
• Reduced technical complexity and Faster and more scalable report development
The Role of Business Performance Analytics (BPA)
Within D365 FO, Business Performance Analytics (BPA) enables reporting aligned to value chains (Procure to Pay, Order to Cash, Record to Report etc.) and end-to-end business processes.
Rather than analyzing isolated transactions, BPA helps organizations evaluate performance across complete processes such as:
• Procure-to-Pay
• Order-to-Cash
• Record-to-Report
This approach shifts reporting from a table-based view to a process-based view, making insights more meaningful for business users and decision-makers.
The Foundation: Facts and Dimensions
The analytical model used by MCP is built on a simple but powerful concept:
Facts
Facts represent measurable business events. Examples:
• Sales amount
• Purchase quantity
• Cost amount
• Ledger balance
Facts answer the question: “What happened?” Dimensions
Dimensions provide the descriptive context around those facts. Examples:
• Customer
• Vendor
• Product
• Legal entity
• Date
Dimensions answer the question: “In what context did it happen?”
By separating measures (facts) from context (dimensions), analytics become structured, reusable, and scalable.
Where MCP Sits in the Architecture
The MCP server for Analytics acts as a bridge between:
1. The transactional application (D365 FO)
2. Reporting and analytics tools Conceptually, the flow looks like this:

MCP abstracts the underlying data complexity and exposes pre-structured analytical models. This makes reporting easier to design, easier to maintain, and more consistent across the organization.
In simple terms, MCP transforms raw ERP data into structured, process-aligned insights.
Key Requirements for MCP Servers in Microsoft Dynamics 365 Finance and Operations
To successfully configure and use MCP servers in D365 Finance C Operations, the following prerequisites must be met.
1⬛ Version s Environment Requirements D365 Finance s Operations Version
• Recommended: 10.0.47 or later (for the latest enhancements and stability improvements)
Supported Environment Types
MCP servers are supported in:
• Tier 2 Sandbox and above
• Unified Developer Environment
Note: Cloud Hosted Environments (CHE) are not supported.
⬛³ System Configuration Requirements Feature Management
The following feature must be enabled:
• Dynamics 365 ERP Model Context Protocol server

This activates MCP capabilities within the environment.
Allowed MCP Clients
The MCP client application (for example, Visual Studio Code) must be registered in the:
• Allowed MCP Clients form
Navigation: System Administration > Setup > Allowed MCP Clients

This ensures only approved clients can interact with the MCP server.
Authentication
Authentication is handled through:
• Microsoft Entra ID
This provides secure, identity-based access control to MCP services.
Supported MCP Tools / Operations
Once configured, the ERP Analytics MCP server supports specific analytical operations:
1. get_bpa_dataset_schema
Retrieves the schema of the BPA dataset. This allows users to:
• Understand available tables
• Review columns
• Analyze relationships
• Explore the analytical model before building queries
2. execute_dax_query
Executes a DAX query against the default Business Performance Analytics (BPA) dataset. This enables advanced analytical queries directly against structured process data.
Business Performance Analytics (BPA) must be available and deployed in the D365 FO instance. Without the BPA dataset, the MCP server cannot execute DAX queries or expose the analytical schema.
Key Requirements for BPA in Microsoft Dynamics 365 Finance and Operations
System Requirements
Minimum: 10.0.38 (Application version 10.0.1777.94) or later.
Supported Environment Types
MCP servers are supported in:
• Tier 2 Sandbox and above
• Unified Developer Environment
Note: Cloud Hosted Environments (CHE) are not supported
• Power Platform linked with D65 FO (environment linkage on LCS )
• License: Dynamics 365 for Finance is sufficient for BPA
Roles
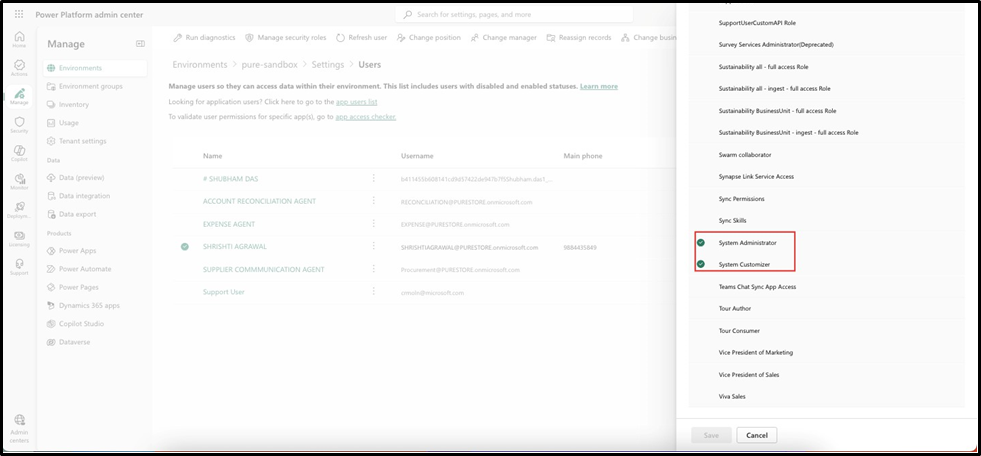
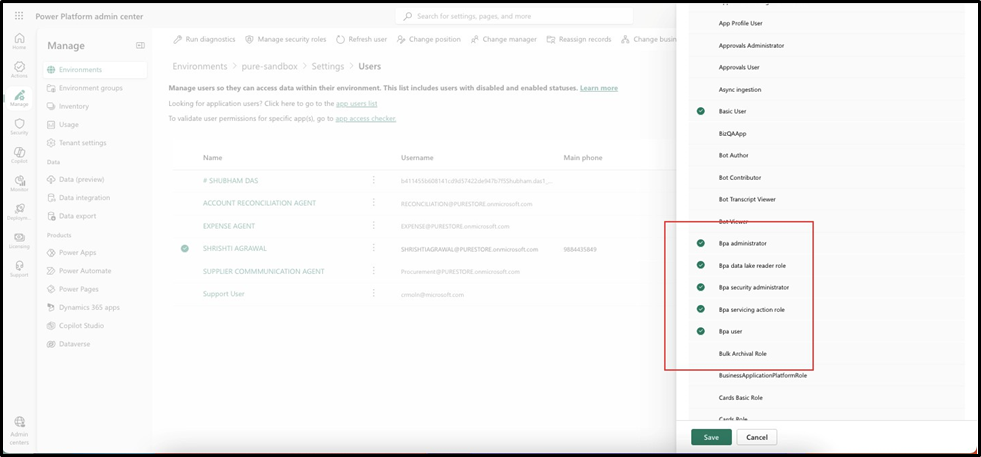
1. In PPAC: For Installation
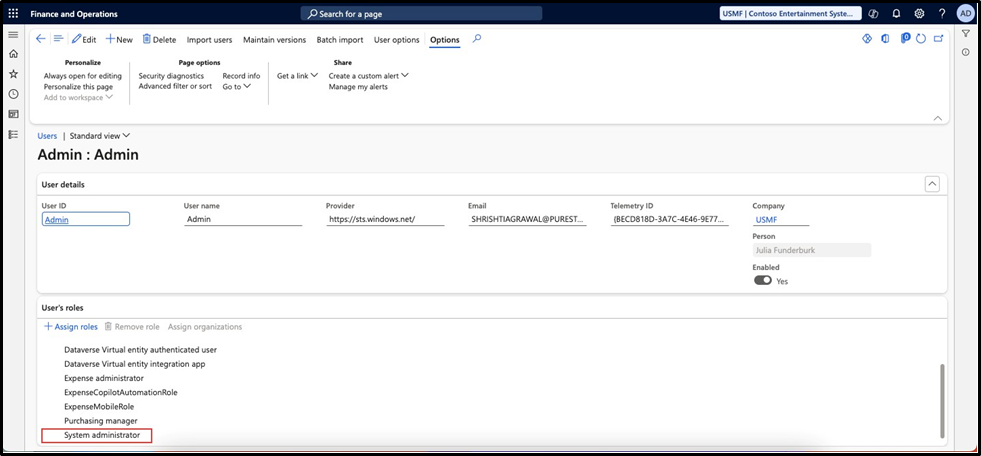
• System Administrator
• System Customizer
3. In D365 Finance and Operations (for Installation only)
• System Administration
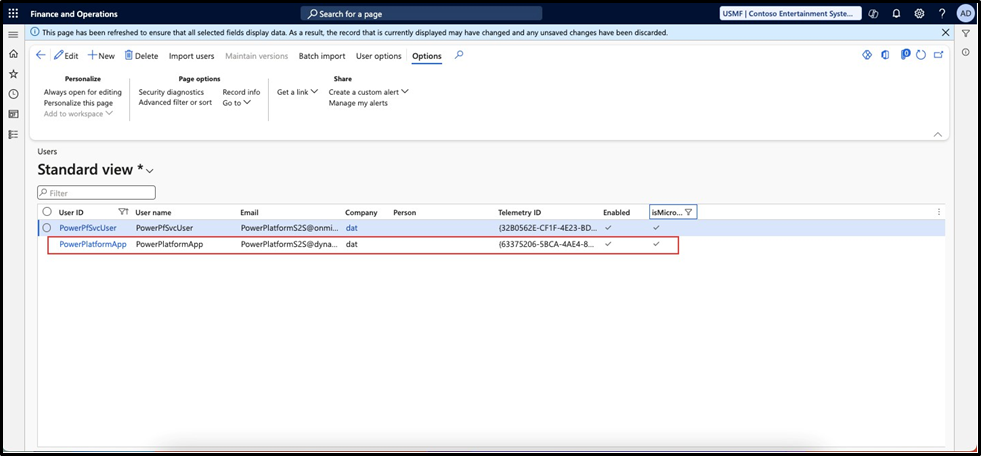
4. Also, In the System Administration > User page, click on the three dots and add a column for IsMicrosoftUser and check if PowerPlatformApp user is enabled
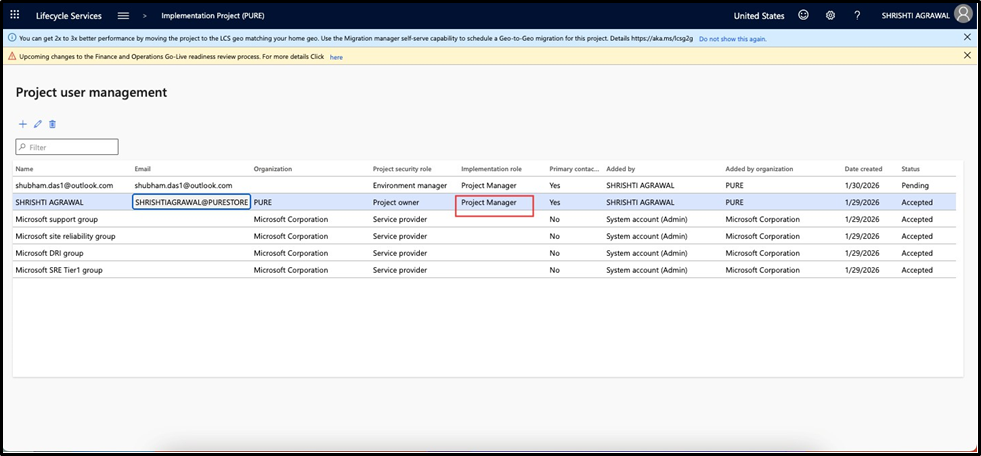
5. In LCS (for Installation only)
• Project Manager
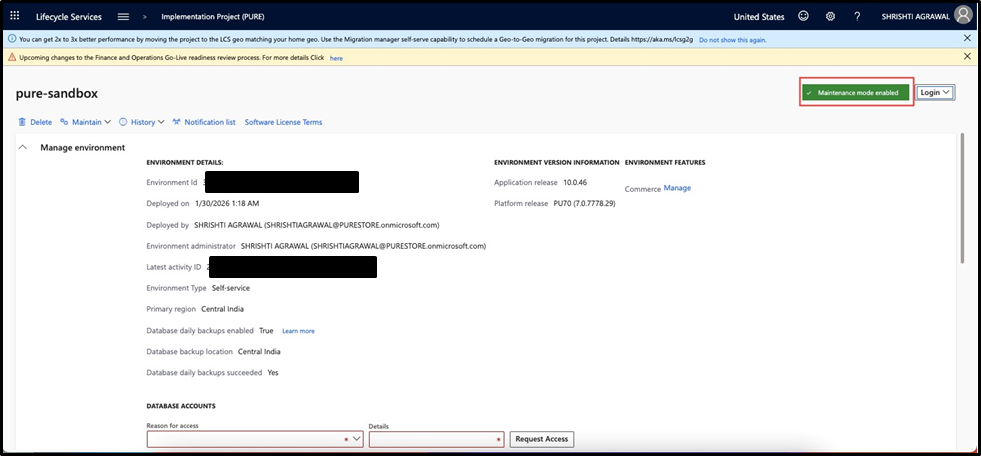
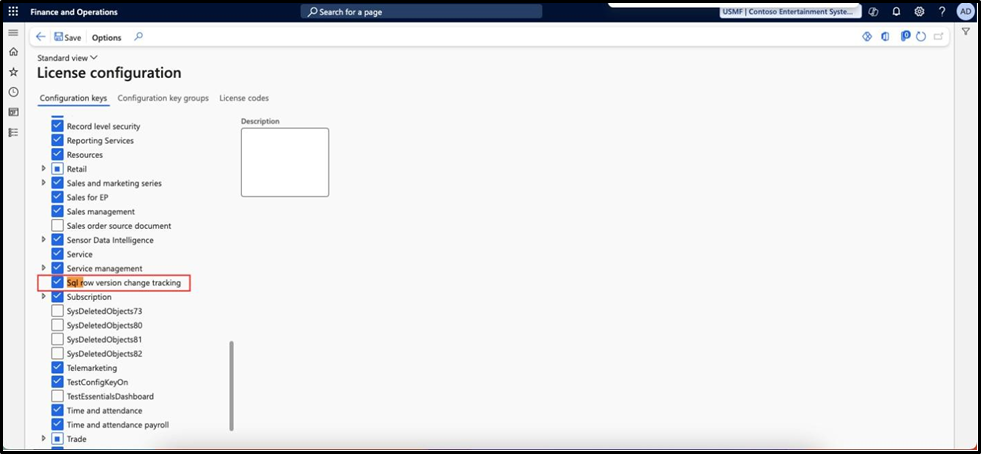
6. SQL row version tracking enablement in D365 FO
• The environment will be put in Maintenance mode through LCS as shown below
- Navigate to System Administrator > Setup > License configuration and check for SQL change tracking enable checkbox on GL, FA, Bank, Trade, Trade Agreements, Purchase
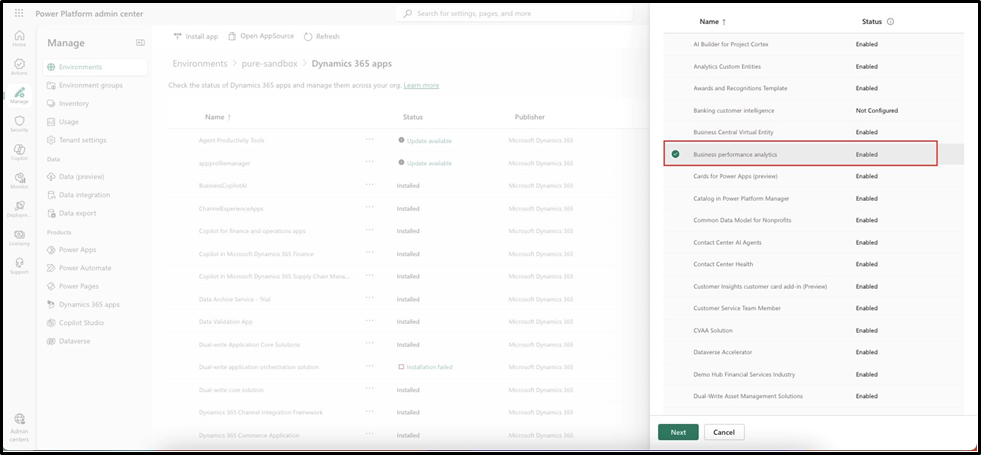
- App Installation from Power Platform Admin Center
- Navigate to Environments > Select your Environment > Resources > Dynamics 365 Apps and Ensure that Finance and Operations Virtual Entity App and BPA app is
Installed. Update the apps to the latest version if the app already exists
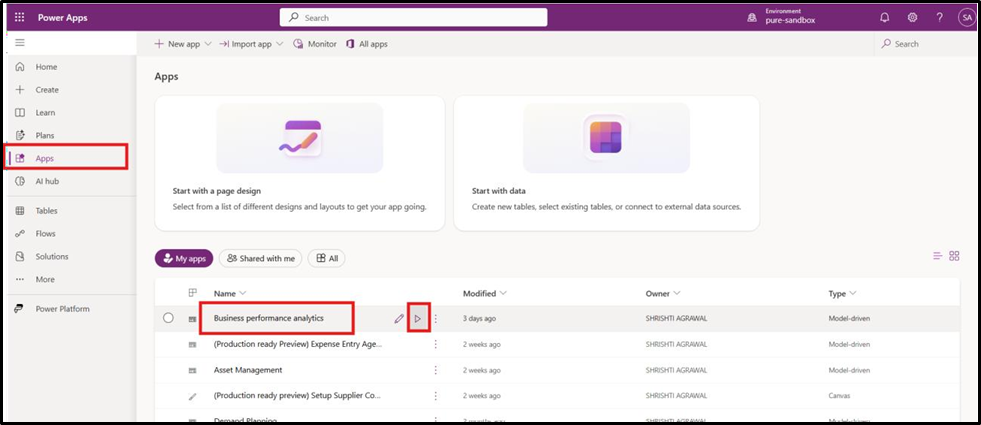
Launching the App
Navigate to Power Apps > Apps and click on the play button for BPA app as shown below.
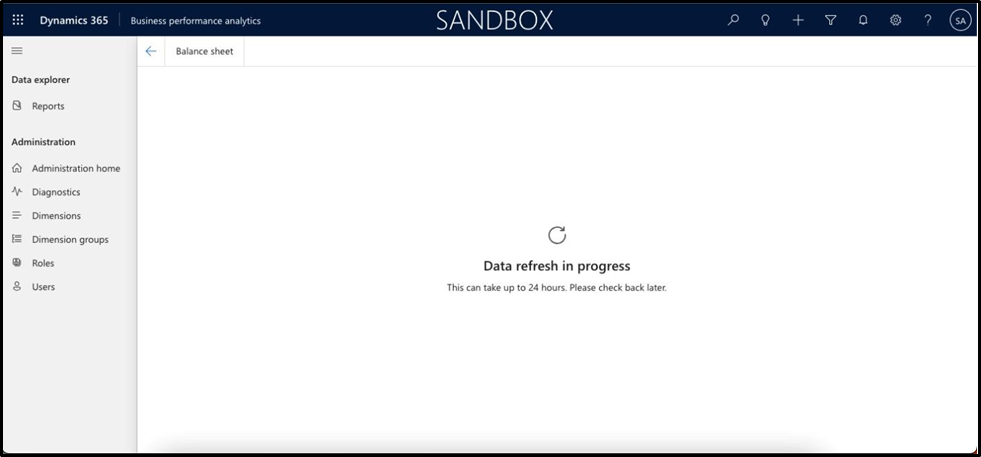
The data refresh happens twice a day and you might encounter the below screen. There is no need to worry here as the data will be available post first refresh
Configuring the BPA application
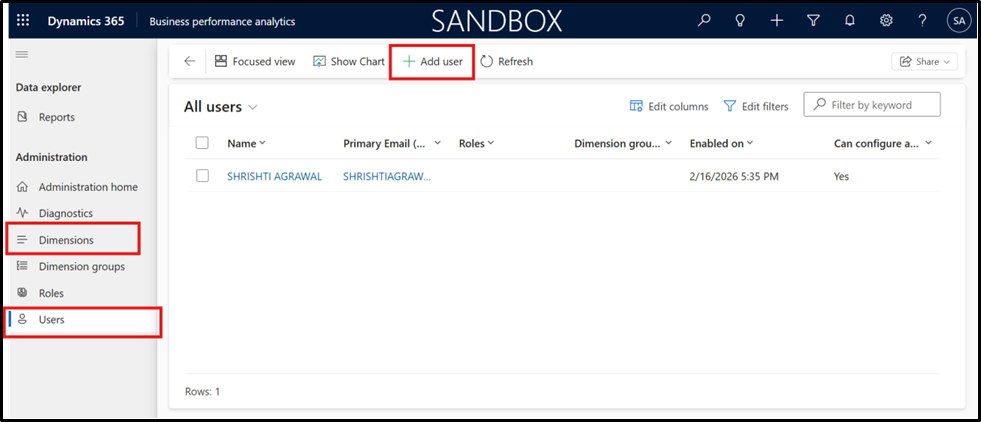
- This is relatively very The Users need to be added with the correct roles such as BPA report viewer, Finance controller etc. and the dimensions (up to 9 needs to
be selected)
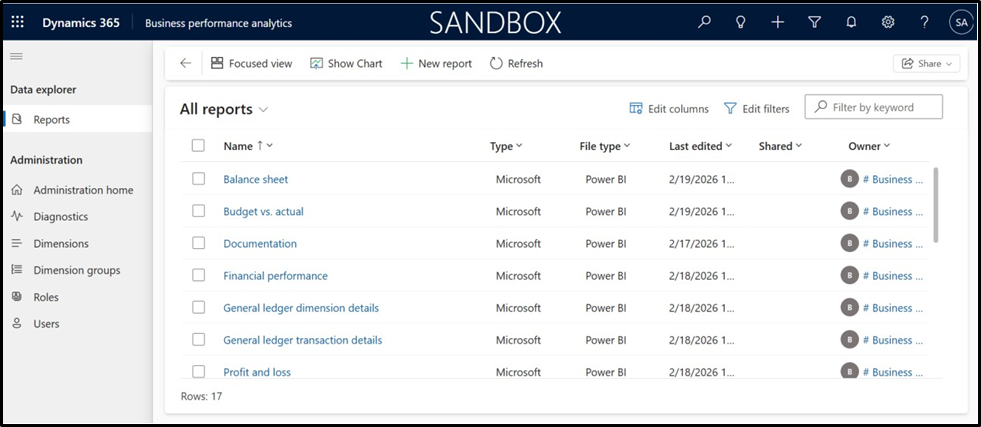
Once the Data is refreshed, certain reports published by Microsoft are visible under reports section
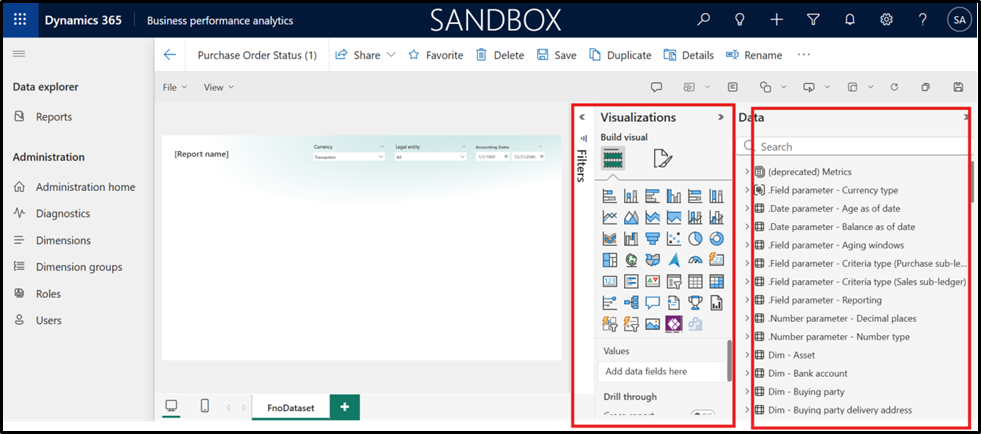
Users can also create their own report by utilizing existing reports or can design the reports in Power BI or excel format from scratch. Report designing makes use of certain Power BI
objects such as Slicer, metrices, bar graph etc. based on the visualizations required and data is available in three forms:- Fact(for numeric values), dimension(the metrices being traced and the form parameters(for filtering data and setting up parameters).
Standard report visual
Balance Sheet
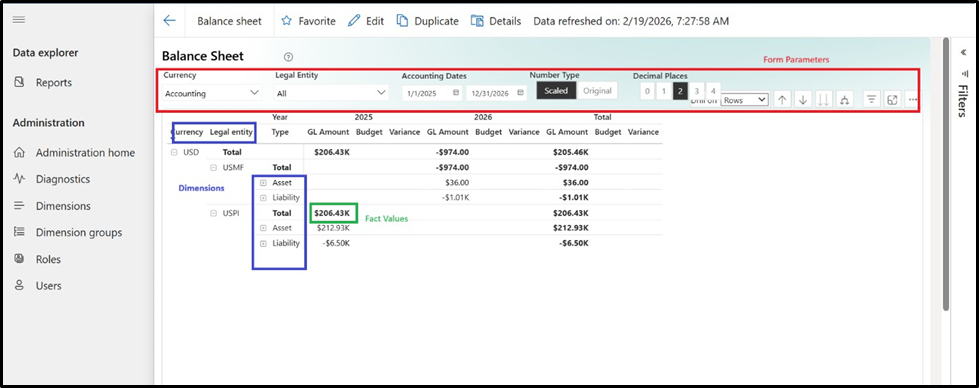
We will not dive deep into the report creation here, but I am attaching a screenshot which showcases the below elements: –
- Tools for creating the report
- Fact tables, Dimension tables and Parameters Visualizations in BPA enable you to:
- Combine facts (measurable values) with dimensions (descriptive attributes)
- Apply parameter-based filters
- Analyze transactional data across value chains
- Create dynamic and interactive reports
They essentially act as the bridge between raw ERP data and business intelligence insights.
- The Data section in BPA contains structured tables that reference transactional and master data from D365 Finance C
- These tables are organized around value chains — representing end-to-end business
Example: Purchase-to-Pay (P2P) Value Chain
Take the Purchase-to-Pay (P2P) value chain as an example:
Within this chain, BPA includes tables such as the Purchase Table, which contains:
Fact Data (Measurable Values)
- Purchase order line amount
- Quantity
- Cost amounts
Dimension Data (Descriptive Attributes)
- Purchase order number
- Invoice number
- Vendor account
- Financial dimensions
These elements allow users to slice and analyze purchasing performance from multiple perspectives.
Together, these tables create a structured semantic model through which D365 FO data is referenced and analyzed inside BPA.
This completes the first objective of our document which was to understand BPA from the Lens of
• Installation and Standard Reporting
• How facts and dimensions drive value chain analysis
Dynamics 365 ERP Analytics
We will use the Copilot MCP client to create a Reporting agent. We will publish the same on M365 and try to extract a report from the system
Let’s get started
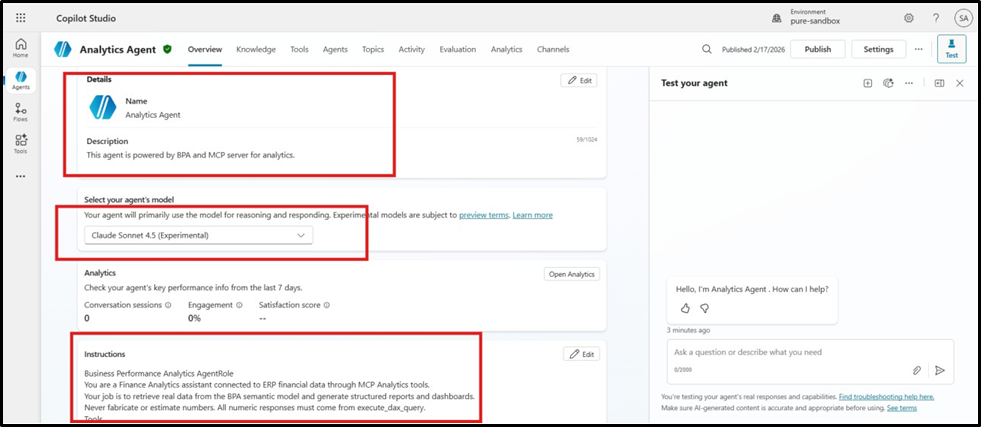
The agent creation process remains the same as explained in my previous documentations. We need to
• Define the name of the agent and the description
• Define Instructions which provide clarity to our LLM model on what steps should be taken to achieve the result with utmost accuracy
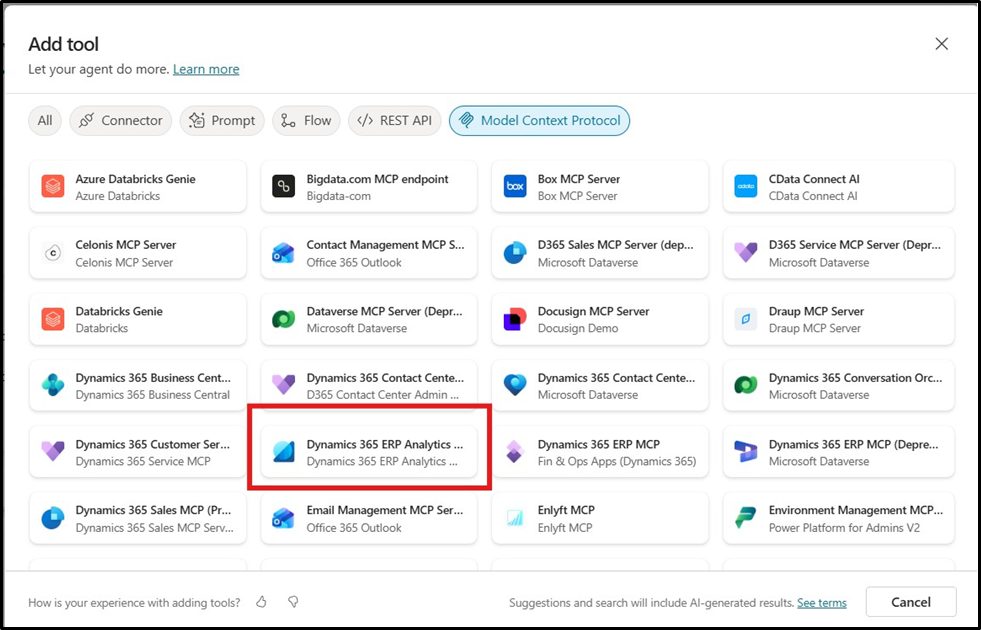
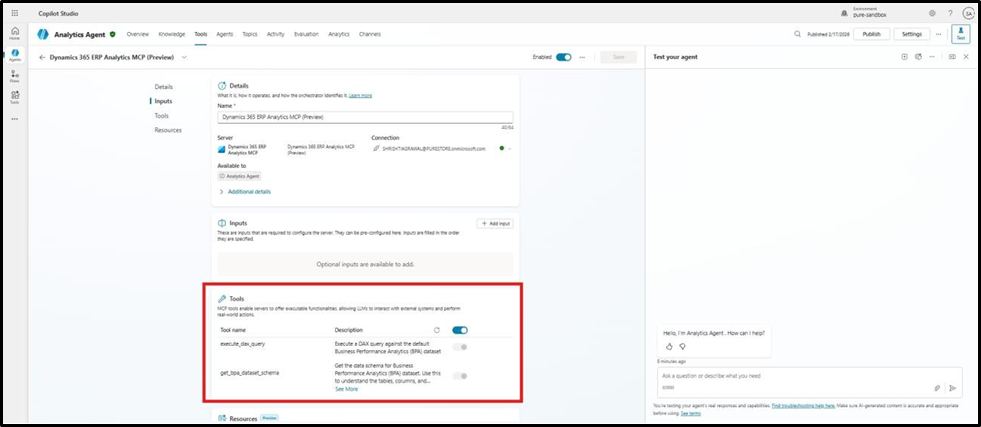
• Add the Dynamics 365 ERP Analytics MCP tools which would enable
get_bpa_dataset_schema and execute_dax_query tools as explained earlier
• Test and Publish the Agent
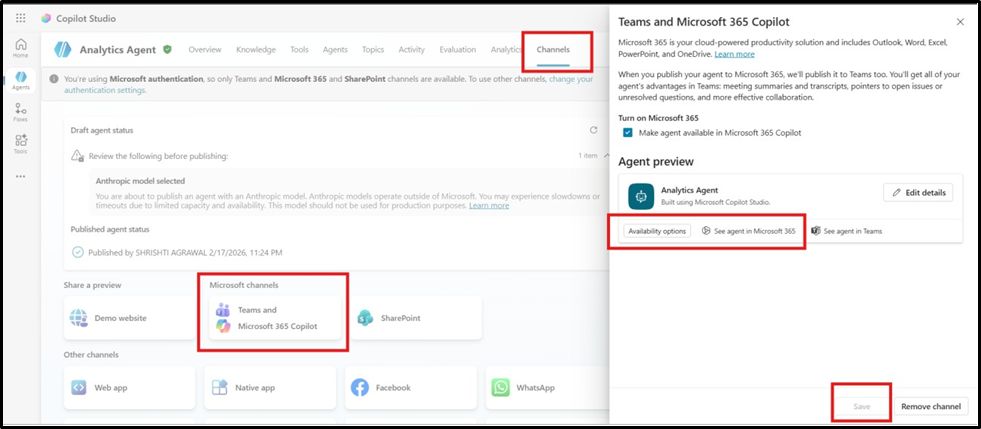
• Add copilot as a channel to execute the agent through M365 Copilot and schedule your prompts for easy access of reports
Adding MCP as a tool
In the tools section, select add tools and filter on Model Context Protocol and select the MCP server shown below. Select a valid connection upon addition
Adding the Channel
In the Channels section, select the Microsoft channels for Teams and Microsoft 365
copilot. In the Availability option, share the same with the teams members and then click
on See agent in Microsoft 365 and click on Save
Agent in Action
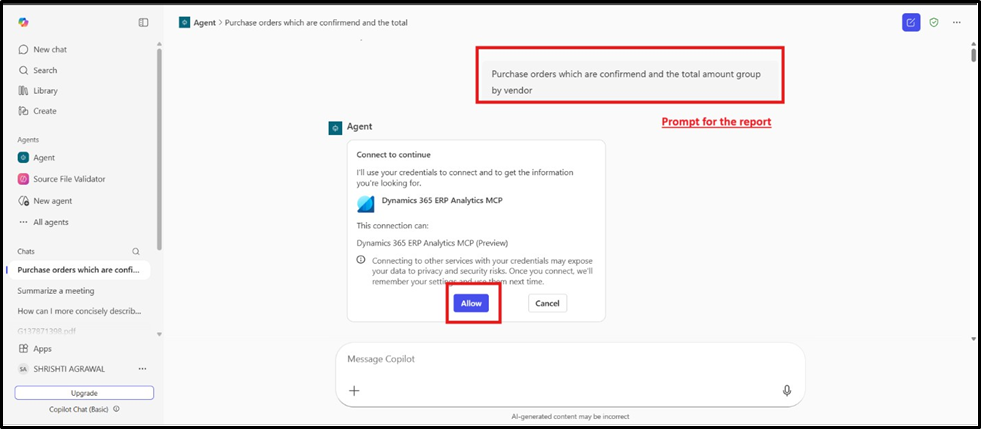
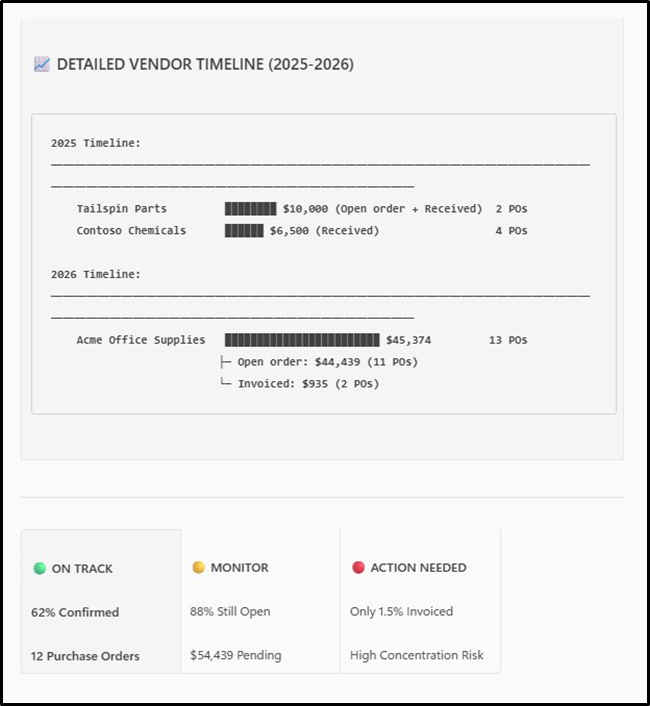
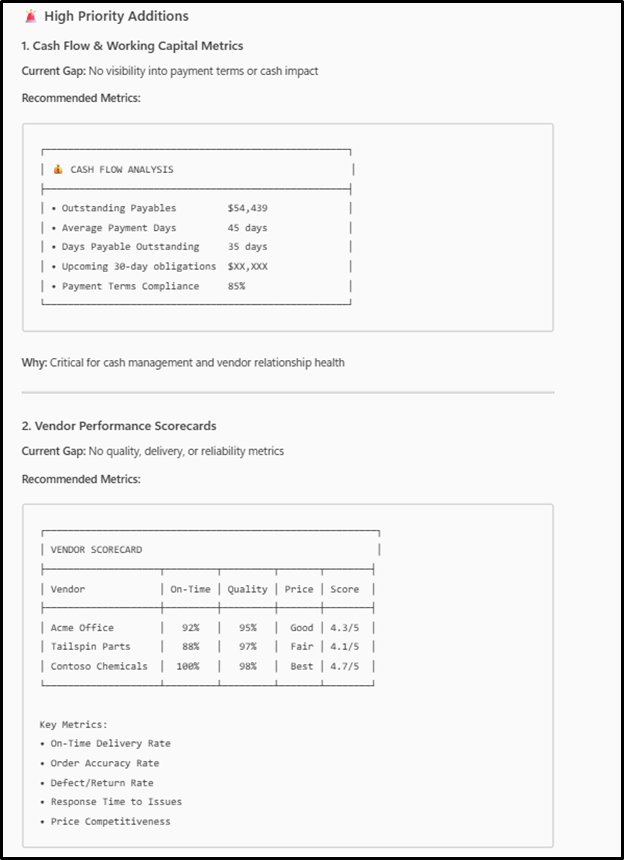
Let’s see the output and validate the same.
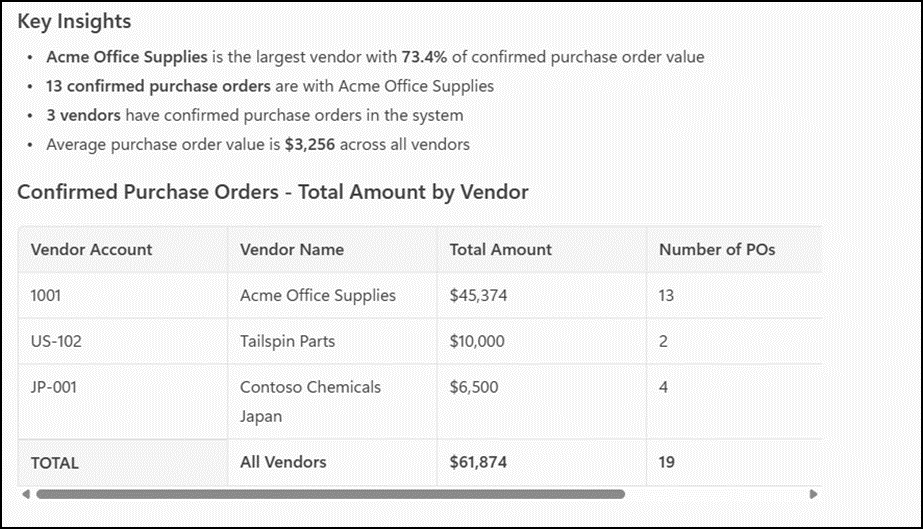
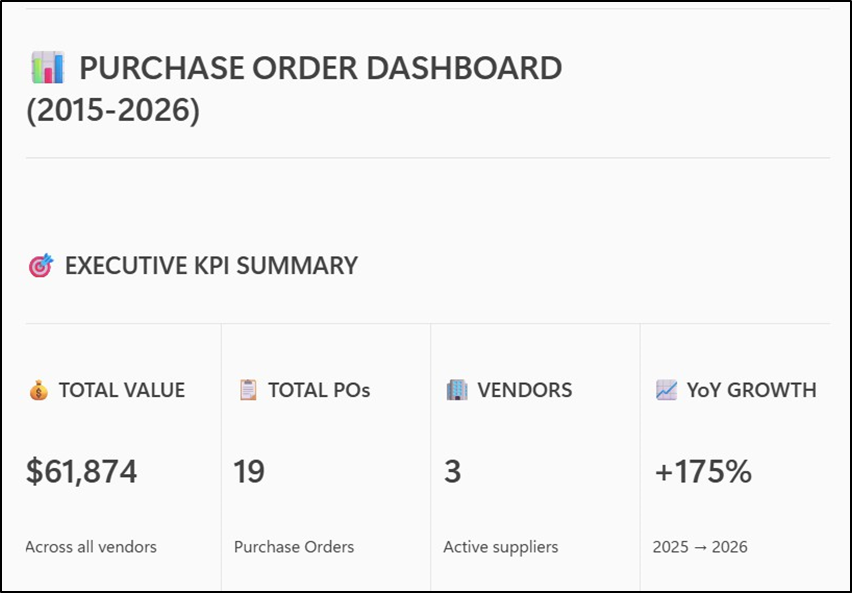
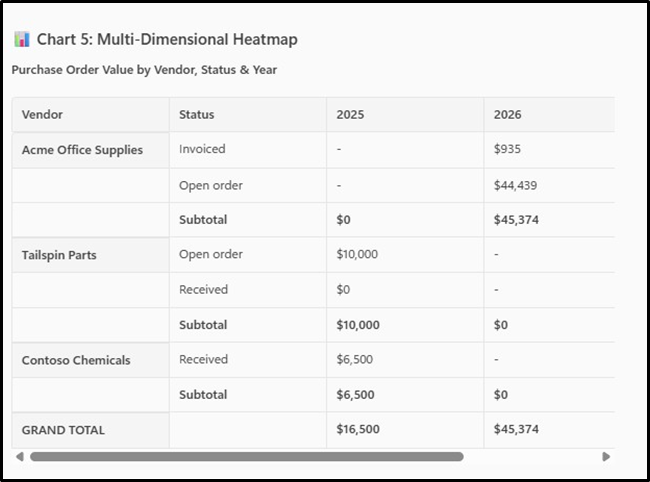
Multiple charts with multiple metrices are shared by the agent and insights are shared, which helps in decision making.
Closing thoughts
As organizations continue to invest in data-driven decision-making, the combination of BPA and MCP in Dynamics 365 Finance C Operations represents a significant leap toward smarter, cleaner, and more scalable analytics. These capabilities not only simplify reporting for new learners but also empower seasoned professionals to build advanced,
AI-enabled insights with confidence. By embracing structured data models, secure analytical layers, and seamless Copilot integration, businesses can unlock clarity across their value chains and transform raw ERP data into powerful, actionable intelligence. The future of enterprise reporting is here—and it’s model-driven, process-aware, and deeply intelligent.


Leave a Reply
You must be logged in to post a comment.